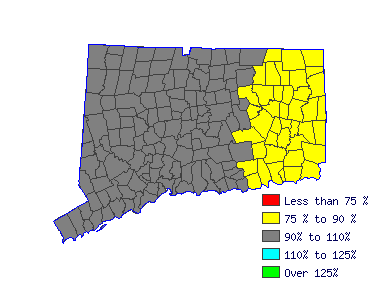
| Southwest WDA (1Q 2016) |
| All Industry |
| Estimated employment | 4,590 |
| Mean wage | $81,471 |
| Entry wage | $56,352 |
| 10th percentile wage | $52,435 |
| 50th percentile wage | $81,394 |
| 90th percentile wage | $115,129 |
 | | Top Employing Industries |
| Industry | Employment / Percent |
| Education and Health Services | 4,590 | 100% |
 |
| Top Paying Industries |
| Industry | Employment / Median Wage |
| Education and Health Services | 4,590 | $81,394 |
 | |
 |
| Elementary School Teachers, Except Special Education (25-2021) |
| Teach pupils in public or private schools at the elementary level basic academic, social, and other formative skills. Exclude "Special Education Teachers" (25-2041 through 25-2043). |
 |
| Mean Wage History |
| Year | This
Occupation | Compared to
Occupational Group | Difference |
| Current | $81393.77 | | $61639.57 |
| $19754.20 | | 2015 | $79326.63 | +2.6% | $60074.12 |
+2.6% | $19252.51 | | 2014 | $77840.87 | +1.9% | $58948.95 |
+1.9% | $18891.91 | | 2013 | $76355.11 | +1.9% | $57823.79 |
+1.9% | $18531.32 | | 2012 | $74869.35 | +2.0% | $56698.62 |
+2.0% | $18170.73 | | 2011 | $73706.58 | +1.6% | $55818.06 |
+1.6% | $17888.53 | | 2010 | $72414.62 | +1.8% | $54839.65 |
+1.8% | $17574.97 | | 2009 | $71639.44 | +1.1% | $54252.61 |
+1.1% | $17386.83 | | 2008 | $69507.70 | +3.1% | $52638.24 |
+3.1% | $16869.46 | | 2007 | $67182.16 | +3.5% | $50877.11 |
+3.5% | $16305.05 |
| Year | This
Occupation | Compared to
All Occupations | Difference |
| Current | $81393.77 | | $48577.28 |
| $32816.49 | | 2015 | $79326.63 | +2.6% | $47218.20 |
+2.9% | $32108.42 | | 2014 | $77840.87 | +1.9% | $46208.60 |
+2.2% | $31632.26 | | 2013 | $76355.11 | +1.9% | $45276.67 |
+2.1% | $31078.44 | | 2012 | $74869.35 | +2.0% | $44500.05 |
+1.7% | $30369.30 | | 2011 | $73706.58 | +1.6% | $43801.10 |
+1.6% | $29905.48 | | 2010 | $72414.62 | +1.8% | $43063.31 |
+1.7% | $29351.30 | | 2009 | $71639.44 | +1.1% | $42480.85 |
+1.4% | $29158.59 | | 2008 | $69507.70 | +3.1% | $41393.59 |
+2.6% | $28114.11 | | 2007 | $67182.16 | +3.5% | $40073.34 |
+3.3% | $27108.82 |
 |
|
| Reference Date: 1st Quarter 2016 |
| Top Areas For This Occupation |
| Best Pay |
|
| Southwest |
$81,394 |
4,590 |
| Northwest |
$77,536 |
3,130 |
| North Central |
$77,333 |
4,980 |
| South Central |
$73,380 |
3,560 |
| Eastern |
$71,728 |
1,840 |
|
| Highest Employment |
|
| North Central |
$77,333 |
4,980 |
| Southwest |
$81,394 |
4,590 |
| South Central |
$73,380 |
3,560 |
| Northwest |
$77,536 |
3,130 |
| Eastern |
$71,728 |
1,840 |
|
|

| |


